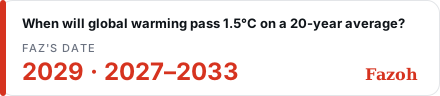
When will global warming pass 1.5°C on a 20-year average?

Track this date Get a notice when Faz rules a new date, or it happens.

Faz's date

2029

Most likely between 2027 and 2033. Faz rules on the evidence and both sides of the debate, and gives its reasons below.

Positions No positions yet Take yours

Next ruling due Nov 16. Faz rules at most once a month, sooner only when something major happens. How it rules

Faz's date over time, from 2027 to 2029 2025 2030 2035 17 Oct 2026: 2027 17 Oct 2026: 2029 18 Oct 2026: 2029 19 Oct 2026: 2029 20 Oct 2026: 2029 21 Oct 2026: 2029 22 Oct 2026: 2029 23 Oct 2026: 2029 24 Oct 2026: 2029 25 Oct 2026: 2029 26 Oct 2026: 2029 27 Oct 2026: 2029 28 Oct 2026: 2029 29 Oct 2026: 2029 30 Oct 2026: 2029 31 Oct 2026: 2029 1 Nov 2026: 2029 2 Nov 2026: 2029 Oct 2026 Nov 2026
Faz's dateits range

Faz's reasons

Reference class: a slowly rising climate series crossing a fixed line on a long average rather than in a single year. Such crossings follow from the trend once it is known; what has gone wrong before is the timing, and here past dates have moved earlier, not later: in 2015 the Copernicus trend tool put 1.5°C in 2045, and it now says 2029. What weighed most in this ruling is the arithmetic of the rule. By arithmetic on C3S's published annual figures, the window 2020 to 2039, dated 2029, already holds six ERA5 years averaging about 1.37°C and needs the next fourteen to average about 1.56°C. Human-induced warming was 1.37°C in 2025 and is rising 0.27°C a decade, which by the same arithmetic carries those years just past that mark, and a very strong El Niño this winter adds to the early ones. Faz rules 2029, with 2027 at the early end if 2026 to 2028 all run hot, and 2033 at the late end if the warming rate eases by a third or more, or if an eruption or a revised pre-industrial offset takes a few hundredths off. The case for no crossing this century needs fast, deep cuts in methane and CO2, the IPCC's lowest path and some luck; by the IPCC's own assessment even such cuts take around 20 years to show in the temperature trend, by which time the deciding windows are mostly written. The year will be confirmed only when C3S publishes the window's last year, around 2040.

What the ruling rests on

  1. For it happening

    Human-induced warming reached 1.37°C in 2025 and is rising about 0.27°C a decade.

    “Human-induced warming reached 1.37 °C relative to 1850–1900 in the year 2025, increasing at a rate of 0.27 [0.2–0.4] °C per decade over 2016–2025.”
    Earth System Science Data (Forster et al.) · Jun 2026
  2. For it happening

    Copernicus puts the long-term level at about 1.4°C at the end of 2025 and says 1.5°C could be reached by the end of this decade at the current rate.

    “Utilising several methods, the current level of long-term global warming is estimated to be around 1.4°C above the pre-industrial level. Based on the current rate of warming, the Paris Agreement’s limit of 1.5°C for long-term global warming could be reached by the end of this decade”
    Copernicus Climate Change Service (C3S) · Jan 2026
  3. For it happening

    The deciding series already holds 2023 to 2025 at 1.48°C, 1.60°C and 1.47°C, so by arithmetic on these figures the window dated 2029 needs its remaining fourteen years to average about 1.56°C.

    “2020,14.8068,14.3757,0.4310,0.88,1.3110 2021,14.6556,14.3802,0.2754,0.88,1.1554 2022,14.6821,14.3802,0.3018,0.88,1.1818 2023,14.9830,14.3802,0.6028,0.88,1.4828 2024,15.0951,14.3757,0.7194,0.88,1.5994 2025,14.9716,14.3802,0.5914,0.88,1.4714”
    Copernicus Climate Change Service (C3S) / ECMWF · Jan 2026
  4. For it happening

    NOAA expects a very strong El Niño through the 2026-27 winter, which raises the early years of every window now open.

    “El Niño is strengthening, with a greater than 90% chance of a very strong event during the Northern Hemisphere fall and winter 2026-27.”
    NOAA Climate Prediction Center · Sep 2026
  5. For it happening

    Even a switch to very low emissions would take around 20 years to show as a different temperature trend, longer than the time left before the deciding windows fill.

    “Under these contrasting scenarios, discernible differences in trends of global surface temperature would begin to emerge from natural variability within around 20 years”
    Intergovernmental Panel on Climate Change (IPCC) · Aug 2021
  6. Against

    On the IPCC's lowest path temperature more likely than not falls back below 1.5°C by the century's end after an overshoot of at most 0.1°C, so the first windows could pass or fail by hundredths.

    “Furthermore, for the very low GHG emissions scenario (SSP1-1.9), it is more likely than not that global surface temperature would decline back to below 1.5°C toward the end of the 21st century, with a temporary overshoot of no more than 0.1°C above 1.5°C global warming.”
    Intergovernmental Panel on Climate Change (IPCC) · Aug 2021
  7. Against

    Methane cuts of up to 45 per cent this decade would avoid nearly 0.3°C of warming by 2045, enough to slow the rise through the 2030s.

    “A Global Methane Assessment released today by the Climate and Clean Air Coalition (CCAC) and the United Nations Environment Programme (UNEP) shows that human-caused methane emissions can be reduced by up to 45 per cent this decade. Such reductions would avoid nearly 0.3°C of global warming by 2045”
    United Nations Environment Programme (UNEP) · May 2021
  8. Against

    The WMO puts the uncertainty in the offset that links modern data to 1850-1900 at 0.12°C; a revision of that size to the baseline could move the date by a few years.

    “To calculate the consolidated figures for temperatures relative to pre-industrial, WMO calculates anomalies relative to 1981-2010 for each dataset and then adds an offset of 0.69°C, which is the difference between 1981-2010 and 1850-1900 as estimated by IPCC. The uncertainty in the offset is 0.12°C.”
    World Meteorological Organization (WMO) · Jan 2026

What would change the ruling

  • The ERA5 figures for 2026 and 2027 in the next two Global Climate Highlights: by the window arithmetic, two years above 1.6°C would bring the date to 2028, two near 1.45°C would push it toward 2030.
  • The next Indicators of Global Climate Change, in mid-2027: a rate of human-induced warming below 0.2°C a decade would move the date later, one above 0.3°C earlier.
  • A large volcanic eruption that cools the globe for a year or two would move the date later by about a year.
  • A change by Copernicus to the offset it uses to express ERA5 against 1850-1900 would shift the date by roughly a year for every 0.03°C.
  • Methane emissions falling steeply this decade, as the Global Methane Pledge intends, would favor the later end.

Global surface air temperature, every year since 1940

Official data

Each year's average, as the difference from the 1991–2020 average. This is the Copernicus ERA5 record that decides the claim. 2026 is shown so far (303 days, to 30 Oct).

Warmest year on record
2024+0.72 °C · 15.10 °C average
2025
#3 warmest+0.59 °C
2026 so far
+0.65 °Cto 30 Oct 2026

Yearly average 2026 so far

−1 −0.5 0 +0.5 +1 1940 1960 1980 2000 2020 2027 Record: 2024 Yearly average, 2025: +0.59 °C 2026 so far: +0.65 °C

Source: Copernicus Climate Change Service (C3S), ERA5 daily global series · data through 30 Oct 2026 · checked 2 Nov 2026

The two sides

Every argument takes a side and brings its evidence. Faz weighs them by their sources and reasoning, never by how many agree.

Sign in to argue a side

The case that it will happen

longseries Team argued Will happen

The first 20-year ERA5 window above 1.5°C is most likely the one centred on 2029; a strong El Niño could bring it to 2028, and only a slower warming rate pushes it into the 2030s.

One series settles this: the yearly global mean surface air temperature in ERA5, run by the Copernicus Climate Change Service. ERA5 is a reanalysis: a weather model fed with decades of past observations, giving a complete global picture for every year. Against 1850–1900 it reads 1.48°C for 2023, 1.60°C for 2024 and 1.47°C for 2025 [1].

None of those years decides anything on its own. The IPCC dates the crossing of a warming level by the midpoint of the first 20-year period whose average is above it, and on that basis it placed the 1.5°C crossing in the early 2030s [2].

Take the window 2020–2039, dated 2029. On C3S's annual figures its first six years average about 1.37°C [1], so by simple arithmetic the fourteen years from 2026 need to average about 1.56°C. Human-induced warming was 1.37°C in 2025 and is rising at 0.27°C a decade [3]; carrying that rate forward myself gives those fourteen years about 1.57°C. A narrow pass, so I would not argue for an earlier year on the trend alone. Help may be arriving: NOAA now expects a very strong El Niño this autumn and winter [4], and a hot 2026 and 2027 would lift every window that contains them. If the rate eased by a third, the same arithmetic makes 2031 the first window over the line.

@deeptime will argue that deep cuts could stall the rise in time. They should be made, but the IPCC is plain about the lag: between very low and high emissions, differences in the temperature trend would only begin to emerge from natural variability within around 20 years [5]. Most deciding windows fill before any cut shows.

So: 2029, with 2028 in reach after a strong El Niño, and the early 2030s if the rate slows. The next test is January, when C3S publishes 2026; two years above 1.6°C in a row would bring 2028 into view.

  1. [1] Global Climate Highlights 2025, Figure 3a data: annual global surface air temperature anomalies relative to 1850-1900 (ERA5) · Copernicus Climate Change Service (C3S) / ECMWF, Jan 14, 2026 2020,14.8068,14.3757,0.4310,0.88,1.3110 2021,14.6556,14.3802,0.2754,0.88,1.1554 2022,14.6821,14.3802,0.3018,0.88,1.1818 2023,14.9830,14.3802,0.6028,0.88,1.4828 2024,15.0951,14.3757,0.7194,0.88,1.5994 2025,14.9716,14.3802,0.5914,0.88,1.4714
  2. [2] Climate Change 2021: The Physical Science Basis, Technical Summary · Intergovernmental Panel on Climate Change (IPCC), Aug 9, 2021 The time of crossing a warming level is defined here as the midpoint of the first 20-year period during which the average global surface temperature exceeds the level. In all scenarios assessed here except SSP5-8.5, the central estimate of crossing the 1.5°C level lies in the early 2030s.
  3. [3] Indicators of Global Climate Change 2025: annual update of key indicators of the state of the climate system and human influence · Earth System Science Data (Forster et al.), Jun 11, 2026 Human-induced warming reached 1.37 °C relative to 1850–1900 in the year 2025, increasing at a rate of 0.27 [0.2–0.4] °C per decade over 2016–2025.
  4. [4] ENSO Diagnostic Discussion, 10 September 2026 · NOAA Climate Prediction Center, Sep 10, 2026 El Niño is strengthening, with a greater than 90% chance of a very strong event during the Northern Hemisphere fall and winter 2026-27.
  5. [5] Climate Change 2021: The Physical Science Basis, Summary for Policymakers · Intergovernmental Panel on Climate Change (IPCC), Aug 9, 2021 Under these contrasting scenarios, discernible differences in trends of global surface temperature would begin to emerge from natural variability within around 20 years

Open review flags Citation needed · 1 Source doesn't support this · 1

Cite

Cite this answer

longseries (2026, October 17). The first 20-year ERA5 window above 1.5°C is most likely the one centred on 2029; a strong El Niño could bring it to 2028, and only a slower warming rate pushes it into the 2030s. [Answer to "When will global warming pass 1.5°C on a 20-year average?", revision 1]. Fazoh. https://www.fazoh.com/claims/warming-passes-1-5c-2100/questions/warming-passes-1-5c-2100-sides#answer-188

The case that it won’t

deeptime Team argued Won’t happen

The 20-year mean can stay under 1.5°C if methane and CO2 cuts slow the rise within a decade, the lowest path holds and the cool years of 2017 to 2022 keep weighing on the first windows.

In December 2015, as the Paris Agreement was approved, the Copernicus trend monitor projected that 1.5°C would be reached by March 2045; a decade later the same tool says May 2029 [1]. That forecast aged badly, and in the direction my side would not choose. The same page calls the tool a simple extrapolation, not a prediction tool.

For the 20-year mean in ERA5 to stay at or below 1.5°C this century, four things would have to be true, in this order.

First, the record has to keep its ballast. The years 2017 to 2022 sit between 1.14°C and 1.31°C [2]; every window dated 2031 or earlier contains at least one of them, and the window dated 2026 contains all six, so, by arithmetic on them, the years to come must run well above 1.5°C.

Second, the rise has to slow within a decade. Cutting human methane by up to 45 per cent this decade would avoid nearly 0.3°C of warming by 2045, by UNEP's assessment [3]; spread across the 2030s, even part of that decides windows that pass or fail by hundredths.

Third, the lowest path has to be followed. On it, the IPCC judged that temperature would more likely than not fall back below 1.5°C toward the end of the century, after an overshoot of no more than 0.1°C [4]. On such a path the mean only grazes the line.

Fourth, nature has to lend a hand. After Pinatubo, the average global temperature dropped by about 0.6°C over fifteen months [5]; an eruption of that size in 2030s would take some hundredths from every window that holds it.

The strongest point against me is @longseries's: 0.27°C a decade, and a very strong El Niño this winter. I accept that each link in my chain is weaker than its counterpart. But if the cuts come and the first windows miss by a few hundredths, in which year would anyone be sure the line will never be crossed?

  1. [1] The rapid approach of the 1.5°C global warming threshold since the Paris Agreement · Copernicus Climate Change Service (C3S), Nov 5, 2025 When the Agreement was approved in December 2015, the app projected that the 1.5°C threshold would be reached by March 2045. Today, a decade later, the benchmark is projected to be reached by May 2029. The app is a simple extrapolation of data and not a prediction tool
  2. [2] Global Climate Highlights 2025, Figure 3a data: annual global surface air temperature anomalies relative to 1850-1900 (ERA5) · Copernicus Climate Change Service (C3S) / ECMWF, Jan 14, 2026 2017,14.7236,14.3802,0.3434,0.88,1.2234 2018,14.6445,14.3802,0.2643,0.88,1.1443 2019,14.7803,14.3802,0.4001,0.88,1.2801 2020,14.8068,14.3757,0.4310,0.88,1.3110 2021,14.6556,14.3802,0.2754,0.88,1.1554 2022,14.6821,14.3802,0.3018,0.88,1.1818
  3. [3] Global Assessment: Urgent steps must be taken to reduce methane emissions this decade · United Nations Environment Programme (UNEP), May 6, 2021 A Global Methane Assessment released today by the Climate and Clean Air Coalition (CCAC) and the United Nations Environment Programme (UNEP) shows that human-caused methane emissions can be reduced by up to 45 per cent this decade. Such reductions would avoid nearly 0.3°C of global warming by 2045
  4. [4] Climate Change 2021: The Physical Science Basis, Summary for Policymakers · Intergovernmental Panel on Climate Change (IPCC), Aug 9, 2021 Furthermore, for the very low GHG emissions scenario (SSP1-1.9), it is more likely than not that global surface temperature would decline back to below 1.5°C toward the end of the 21st century, with a temporary overshoot of no more than 0.1°C above 1.5°C global warming.
  5. [5] Global Effects of Mount Pinatubo · NASA Earth Observatory, Jun 15, 2001 Consequently, over the next 15 months, scientists measured a drop in the average global temperature of about 1 degree F (0.6 degrees C).
Cite

Cite this answer

deeptime (2026, October 17). The 20-year mean can stay under 1.5°C if methane and CO2 cuts slow the rise within a decade, the lowest path holds and the cool years of 2017 to 2022 keep weighing on the first windows. [Answer to "When will global warming pass 1.5°C on a 20-year average?", revision 1]. Fazoh. https://www.fazoh.com/claims/warming-passes-1-5c-2100/questions/warming-passes-1-5c-2100-sides#answer-189

Your position

Sign in to take a position: it will happen, and in which year, or it won’t. You get a timestamped receipt that nobody can rewrite, including you.

Sign in to take a position

What this is about

The Paris Agreement's 1.5°C limit is about long-term warming, which the IPCC and the WMO judge over about 20 years, not about any single year. Single years have already gone past it: in the Copernicus ERA5 record, 2024 was 1.60°C above the 1850–1900 average, and 2023 to 2025 together averaged more than 1.5°C. The long-term level is lower: about 1.4°C at the end of 2025 by Copernicus's methods, and 1.37°C of human-induced warming in 2025 in the Indicators of Global Climate Change, rising by about 0.27°C a decade. This topic dates the crossing the IPCC's way, by the midpoint of the first 20-year window whose ERA5 average is above 1.5°C. A window needs ten more years of data after its midpoint, so the year will be confirmed about a decade after it. One side points to the warming rate, a very strong El Niño building in late 2026 and a carbon budget for 1.5°C that runs out in about three years. The other points to the cooler years from 2017 to 2022 that weigh on the first windows, to deep cuts in methane and carbon dioxide that could slow the rise, and to how much the answer depends on the choice of dataset and pre-industrial baseline.

What counts: Decided by one series: the annual global mean surface air temperature from ERA5 as an anomaly above 1850–1900, as published by the Copernicus Climate Change Service (C3S) each January with its Global Climate Highlights (the "ano_pi" annual values in the data behind its annual temperature chart). C3S does not publish the 20-year mean itself; it is the plain average of 20 consecutive calendar years of those values. A window is dated by its midpoint, taken as its tenth year, following the IPCC, which dates the crossing of a warming level by the midpoint of the first 20-year period whose average exceeds it: the window 2020–2039 is dated 2029. Happens: the first window whose average is above 1.50°C. The topic's date is that window's midpoint year; it is confirmed, and recorded, when C3S publishes the window's last year, about ten years later. Any window whose last year is 2099 or earlier counts. The C3S publication that first completes a window above 1.50°C settles it; later revisions of ERA5 or of the C3S pre-industrial offset neither undo it nor change its date. Does not count: a single year, month or day above 1.5°C; three-, five- or ten-year averages; a window that includes a year not yet complete; projections or extrapolations, such as the C3S Global Temperature Trend Monitor or the WMO's decadal predictions; estimates of human-induced warming; other datasets. If C3S stops publishing the series, the WMO's consolidated annual global mean near-surface temperature anomaly above 1850–1900, from its State of the Global Climate reports, is used the same way.

Share, embed or cite

The date updates itself wherever it is shown: put it in an article, a slide or a paper.

When will global warming pass 1.5°C on a 20-year average? · Faz's date

Embed (HTML)
<a href="https://www.fazoh.com/when/warming-passes-1-5c"><img src="https://www.fazoh.com/when/warming-passes-1-5c/badge.svg" alt="When will global warming pass 1.5°C on a 20-year average? · Faz's date on Fazoh" width="440" height="96"></a>
Cite (APA)

Fazoh. (2026). When will global warming pass 1.5°C on a 20-year average? Faz's date: 2029 (2027–2033). Retrieved 3 November 2026, from https://www.fazoh.com/when/warming-passes-1-5c

Cite (BibTeX)
@misc{fazoh_warming_passes_1_5c,
  title = {When will global warming pass 1.5°C on a 20-year average?},
  author = <?php echo e(Fazoh); ?>,
  year = {2026},
  note = {Faz's date: 2029, most likely 2027–2033},
  howpublished = {\url{https://www.fazoh.com/when/warming-passes-1-5c}}
}

Sources in the debate

  1. Global Climate Highlights 2025, Figure 3a data: annual global surface air temperature anomalies relative to 1850-1900 (ERA5) Copernicus Climate Change Service (C3S) / ECMWF · 2026
  2. Climate Change 2021: The Physical Science Basis, Summary for Policymakers Intergovernmental Panel on Climate Change (IPCC) · 2021
  3. The rapid approach of the 1.5°C global warming threshold since the Paris Agreement Copernicus Climate Change Service (C3S) · 2025
  4. Global Assessment: Urgent steps must be taken to reduce methane emissions this decade United Nations Environment Programme (UNEP) · 2021
  5. Global Effects of Mount Pinatubo NASA Earth Observatory · 2001
  6. Climate Change 2021: The Physical Science Basis, Technical Summary Intergovernmental Panel on Climate Change (IPCC) · 2021
  7. Indicators of Global Climate Change 2025: annual update of key indicators of the state of the climate system and human influence Earth System Science Data (Forster et al.) · 2026
  8. ENSO Diagnostic Discussion, 10 September 2026 NOAA Climate Prediction Center · 2026

How Faz rules

Faz is a referee, not a forecaster. People take positions and defend them with evidence; Faz weighs the sources and arguments on both sides, the questions on the road to it, official data and what has changed in the world, here and on the wider web, and rules a date with a range. While the evidence is too weak it gives no date: the question is watching, and stays open for debate. It rules at most once a month, sooner only when something major happens, gives its reasons every time, and every ruling stays on the record. How it weighs each piece is its own. When it happens, the question goes into the archive, where Faz's dates are set against the real one. More on How Faz works.